Visualizing Compute

The first step to understanding infra is to visualize it - so much of what we do is virtualized, or abstracted away that we tend to forget our code is still running on a rack somewhere. Pictured above is Delta, the high-performance computer (HPC) cluster that we use to run large batch jobs, mainly for model experiments, training, and pipelining. Below it is a single A40 GPU, retailing for about $30,000 USD.
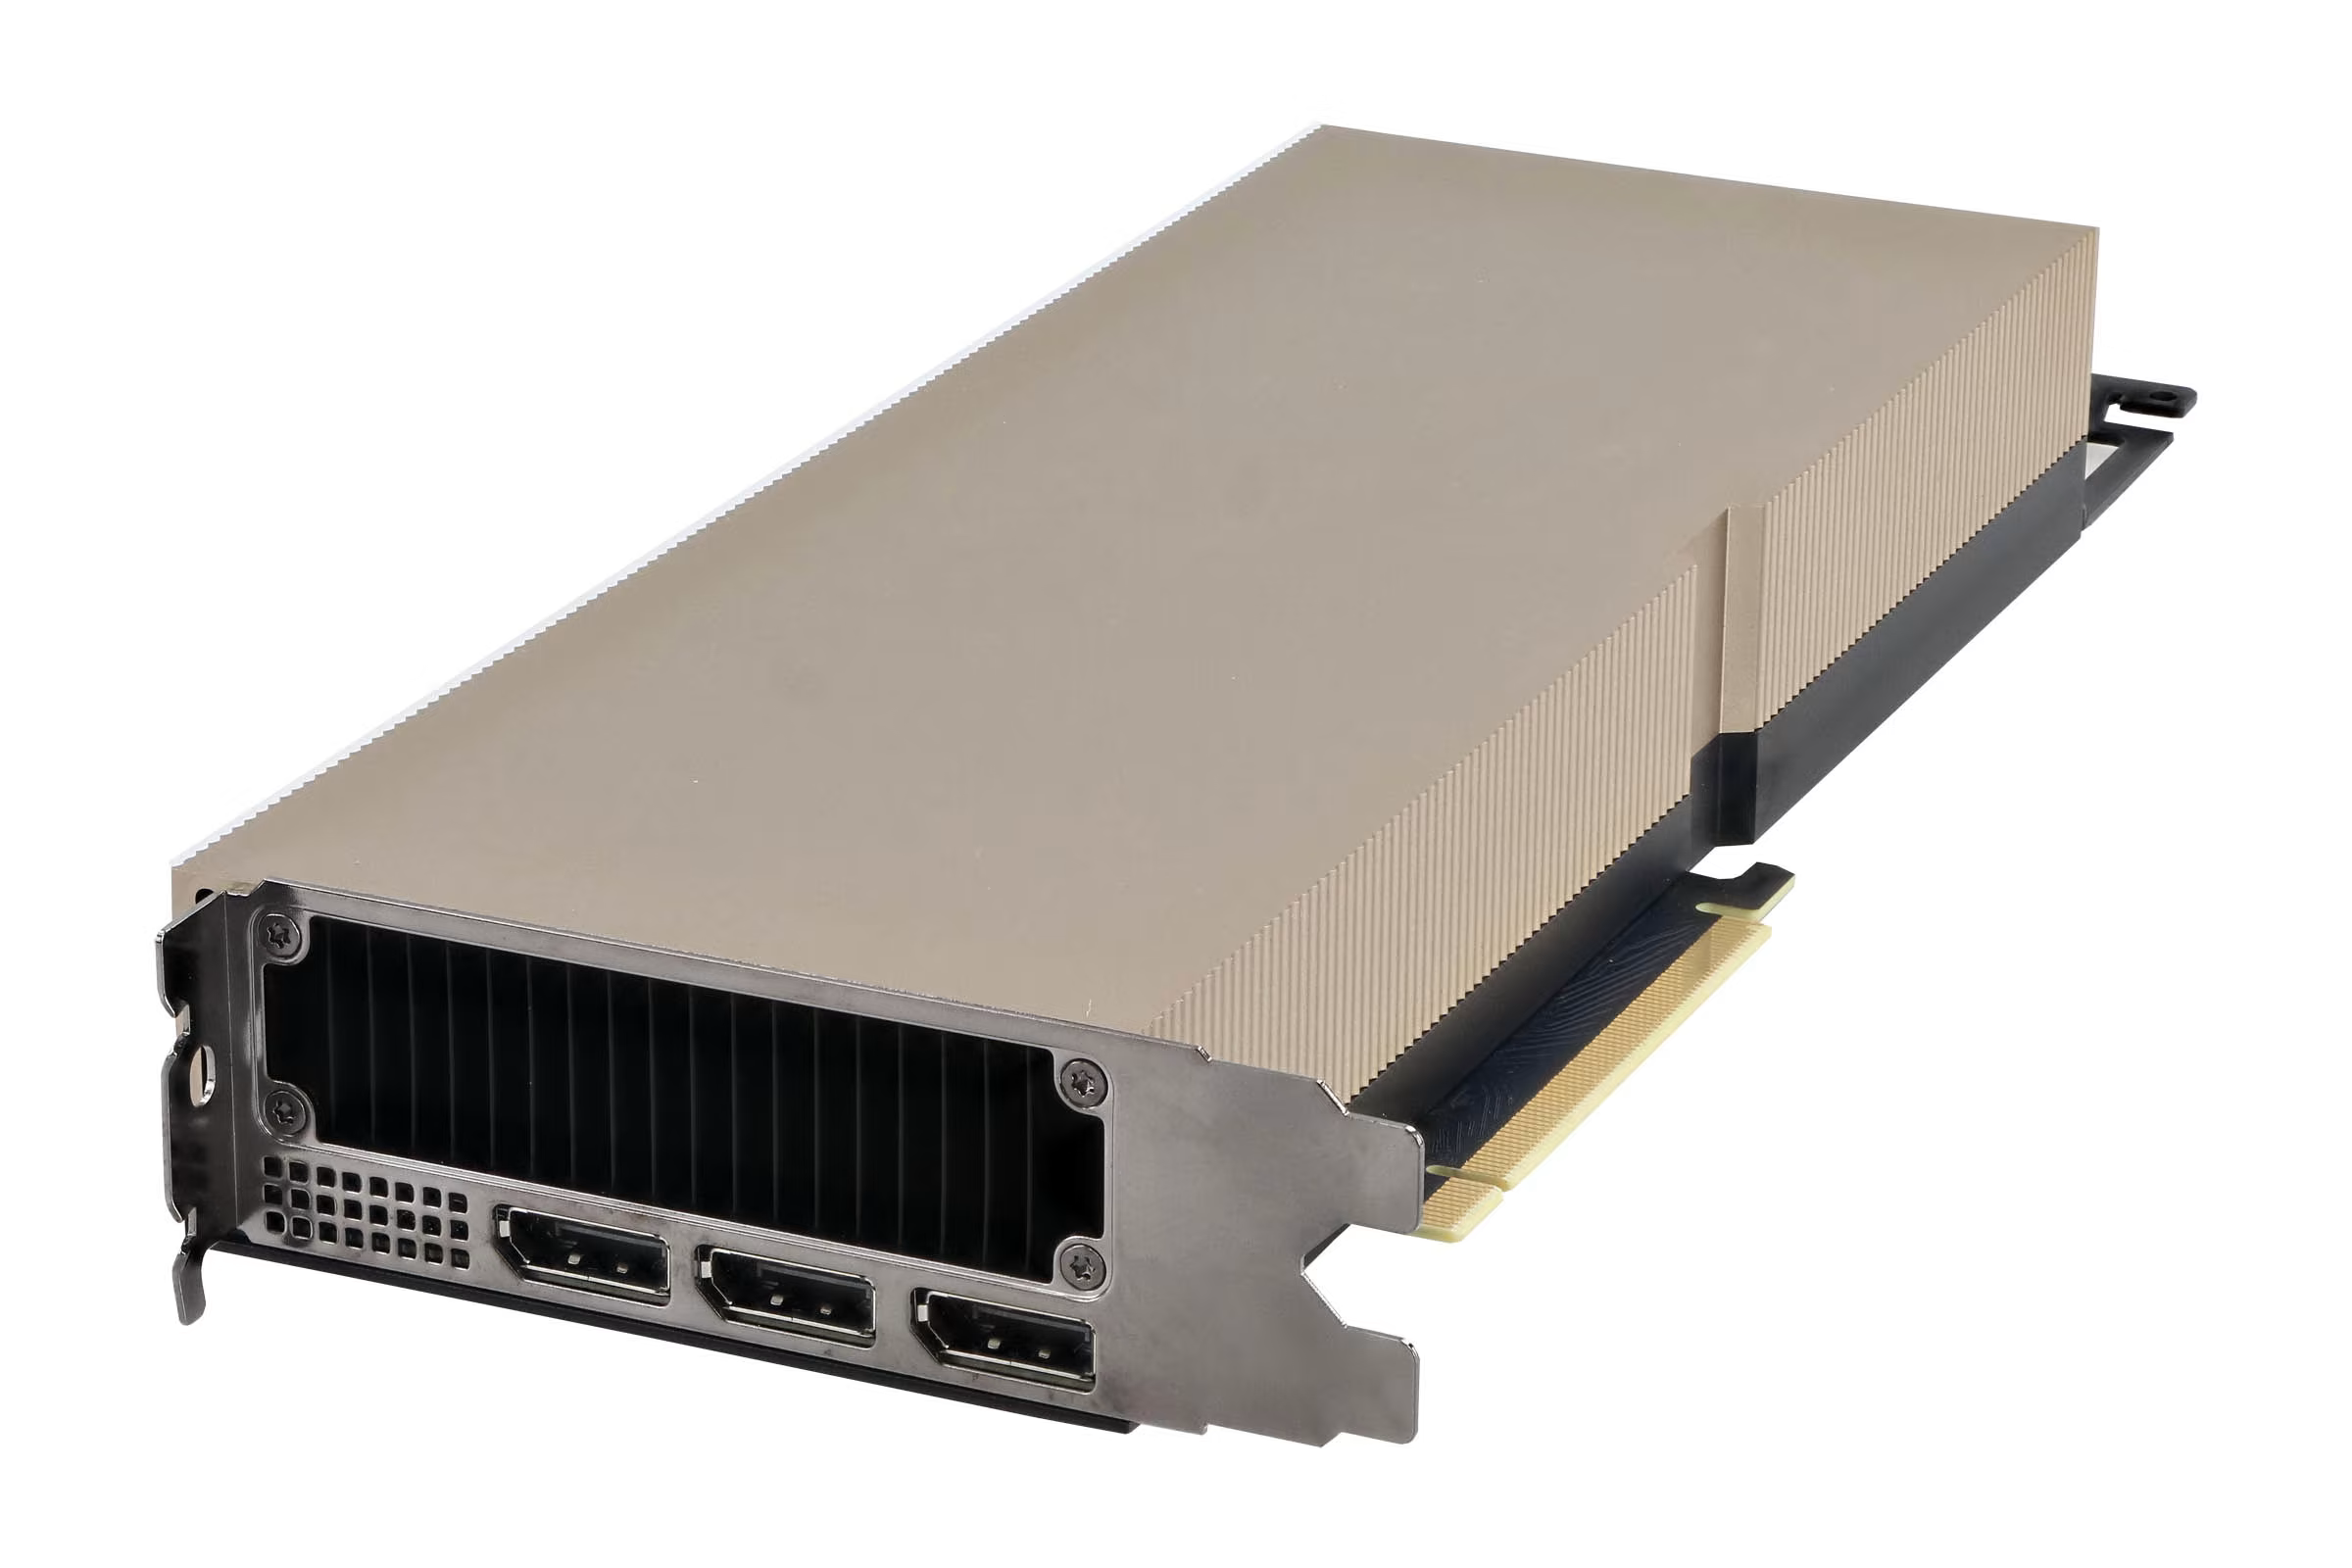
The case around the server racks is actually a form of abstraction in it of itself; you might be surprised to learn that Delta contains nearly 100 four-way A40s (400 total). Reminding ourselves that as developers we are bound to physical hardware, even if it is virtualized, is necessary to contain our desire to merely “hack” away at things rather than write and design scalable systems.
In layman’s terms, it’s significantly easier to imagine ourselves as data center technicians when working with infra. We need to accurately describe our networking, storage, and compute needs, most of the time without knowing exactly what the workload’s resource consumption patterns will look like. If you think of running a job on Delta or deploying a new service as physically setting up the hardware yourself, adding it to the HPC cluster, then a lot of the abstraction will become more intuitive for you.
Virtual Hierarchy
To help you visualize further, we will now traverse the layers of abstraction bottom-up for a service running on JetStream2 (JS2). It is more than fine if some or all of these tools are new to you - typically, consumer hardware is packaged in one piece, and even if you have built a PC before, all of it’s components are colocated on a single motherboard.
- api service
- web service
- worker service
- databases, queues, etc
- yolo
- whisper
- cluster logs
- video uploads
- terraform tfstate
- VM boot + file system
- model-service model weights
Observant readers might notice something - storage and compute are separated categorically (compute vs. storage, standard vs. GPU nodes etc). This aligns with the hardware, e.g. Swift (object storage) does not have the same access patterns that a VM’s boot volume on Cinder. OpenStack Neutron (networking) is not depicted here, but you can imagine now why it might be a good idea to have an interface that enables hundreds of compute and storage resources to be connected or exposed to the internet.
CI/CD
Continuous Integration and Continuous Development is perhaps the most abstract part of our infra, as it’s designed for a simple developer experience (DX). Only two files are needed to integrate with our cluster:
a deploy.yaml file under .github/workflows and a application.yaml file under deploy. There are already a few tutorials here on how to get those configured, but the point here is highlight how even something
you can view and tinker with directly like a file on your computer contains a vast amount of abstraction. Often times the only way to truly understand an abstraction is to go to the source, which in this case are
the helm charts in the infra repo.
It also does not help that CI/CD is more fluid; some heavy images are built on the cluster, while most are built on ubuntu VMs via GitHub Actions. At the end of the day, push to deploy is an amazing feature for DX, but a nightmare for cluster admins if something breaks. Generalized services provided by the cluster tend to be less abstract to use but more complicated to maintain in nature, as prioritizing DX is necessary when working with people with little previous experience with bare metal infra.